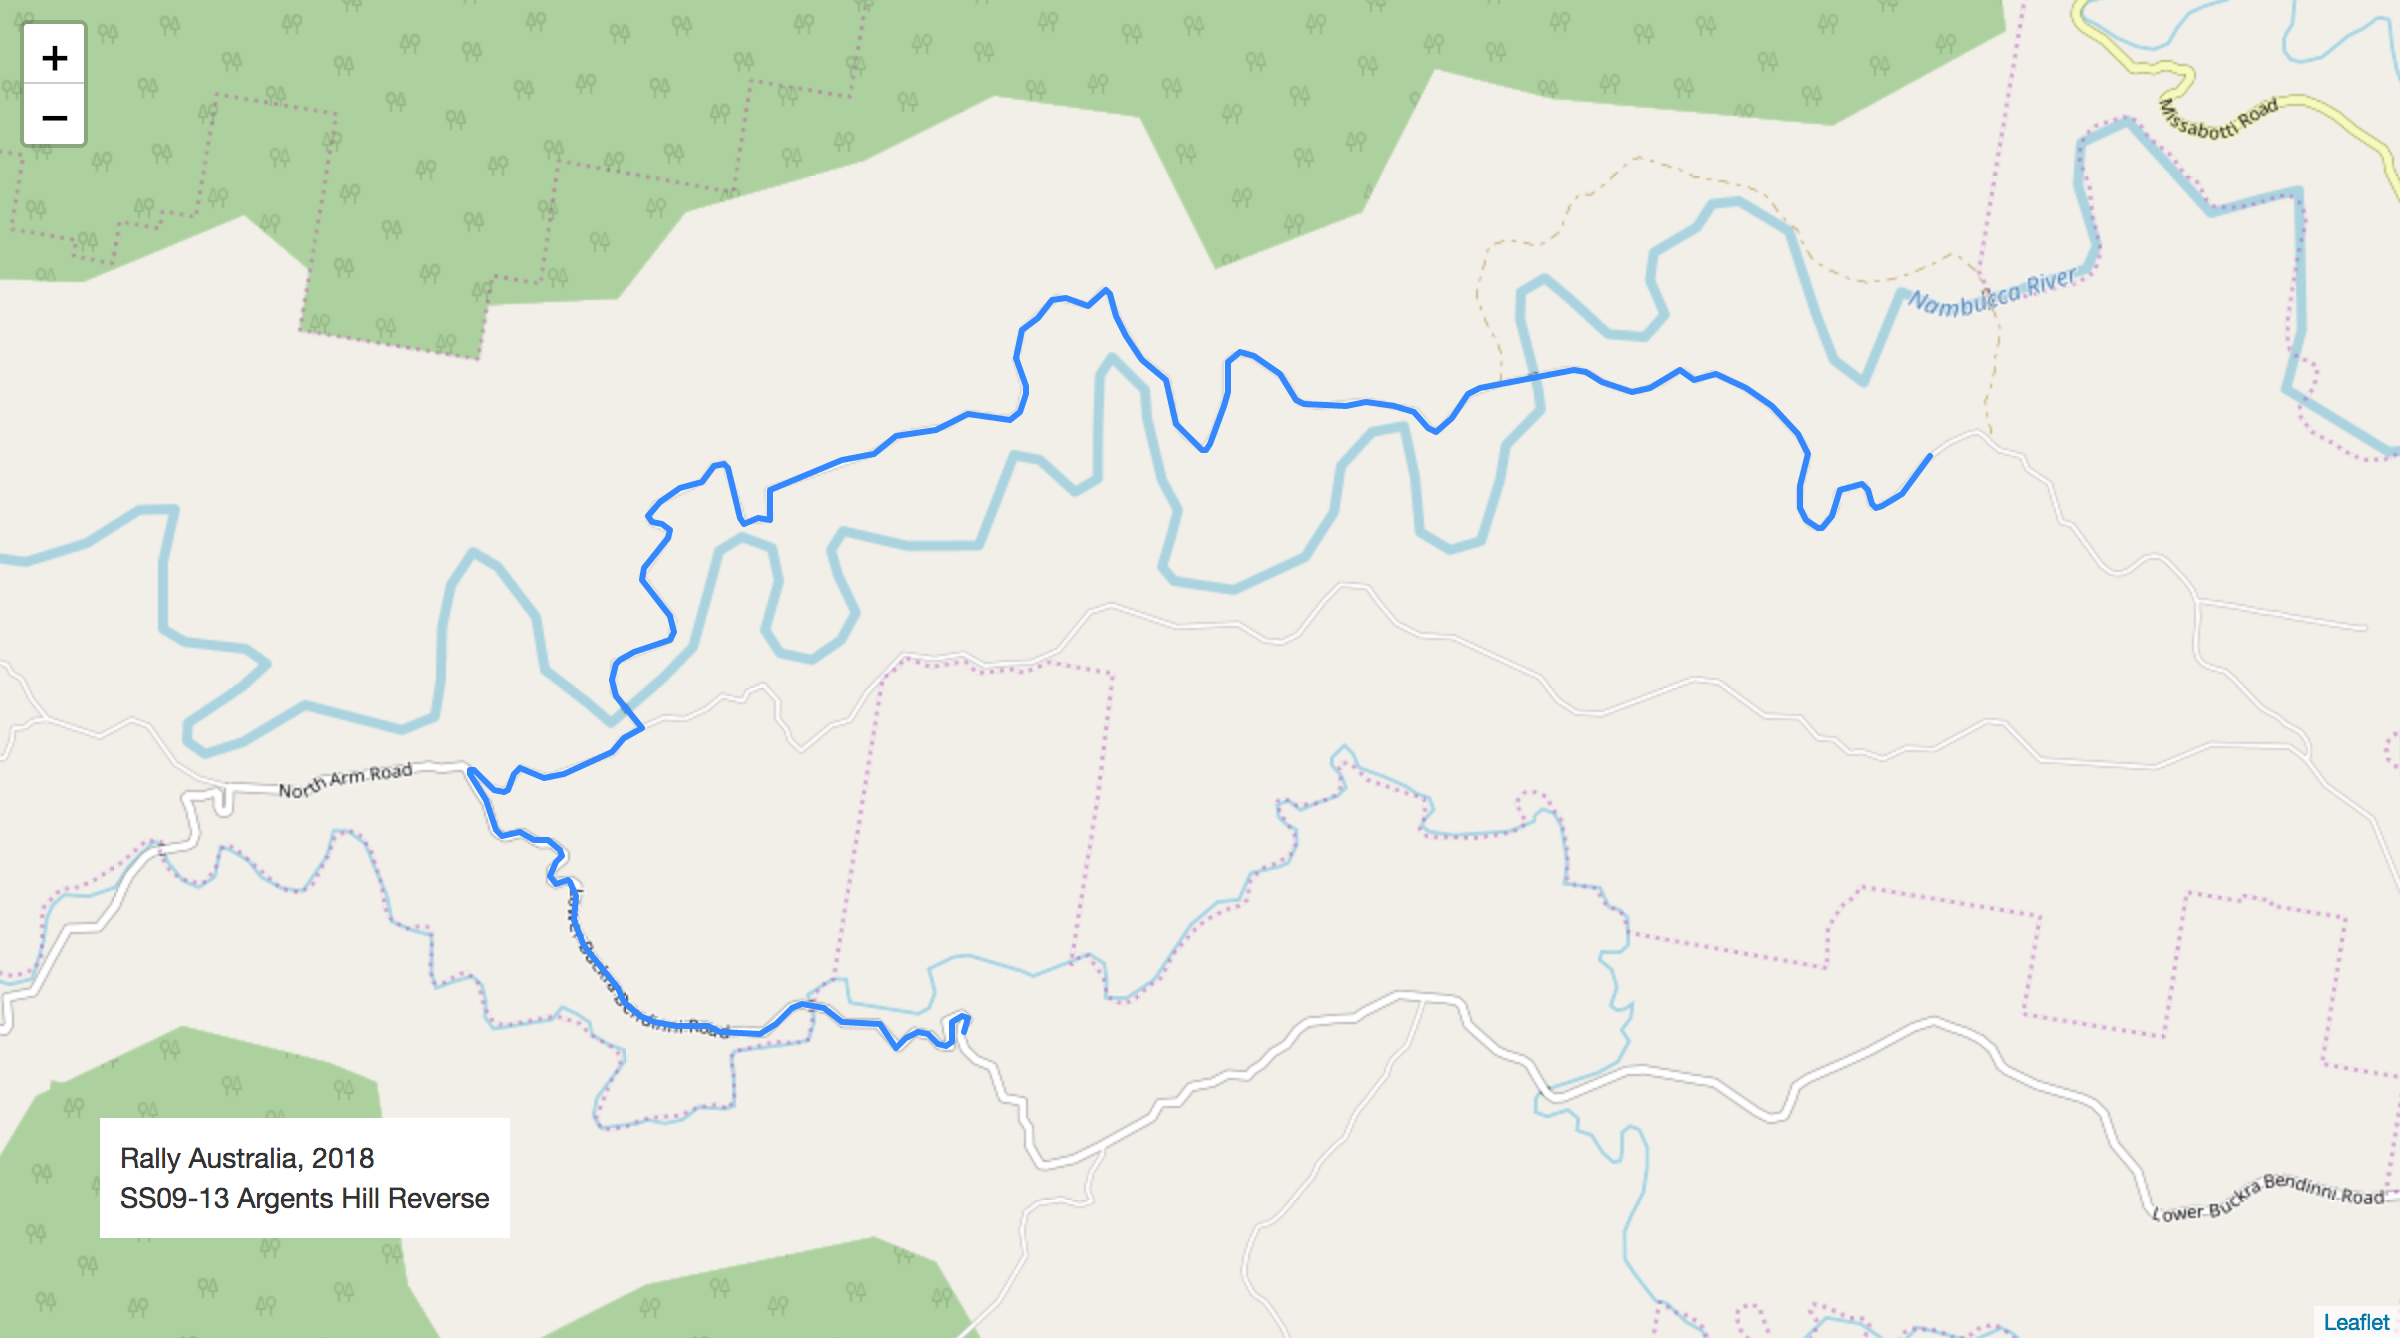
Stage Map - Australia, 2018 - SS13 - Relative Split Times
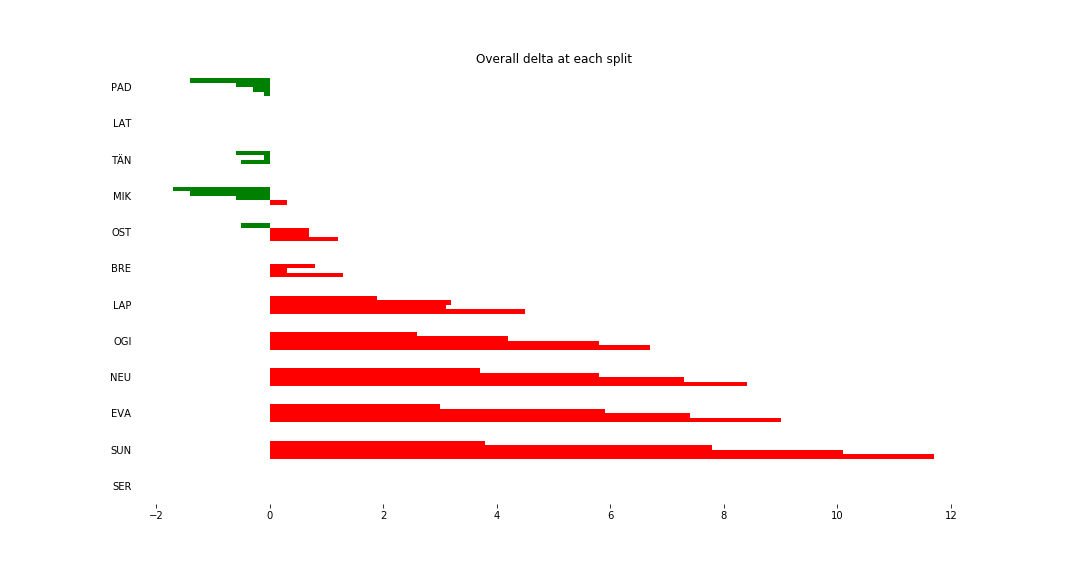
Stage Overall Split Delta Chart - Australia, 2018 - LAT - SS13
For the specified driver, show the overall stage time delta at each split relative to the other drivers.
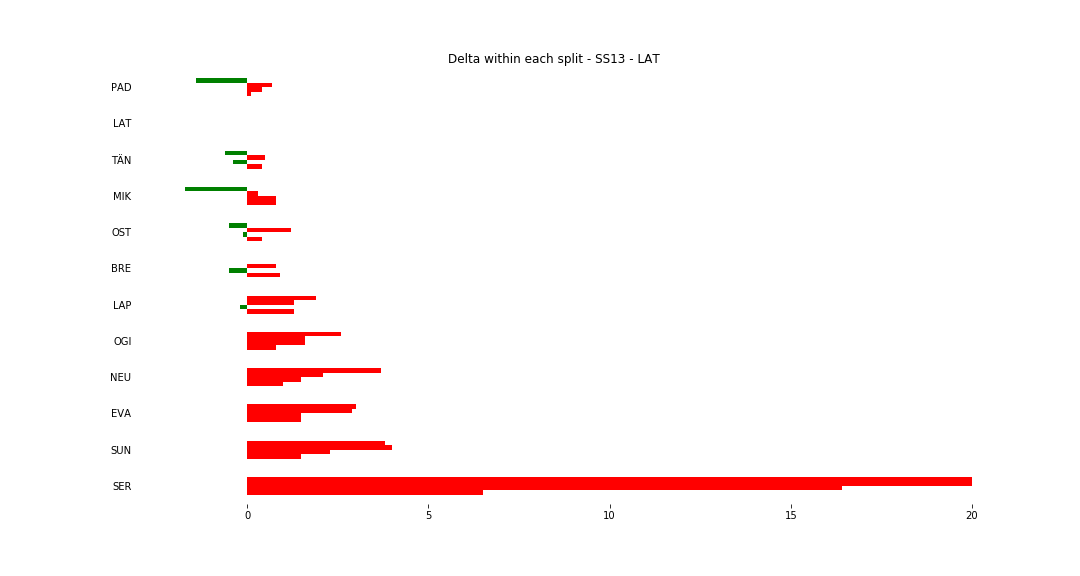
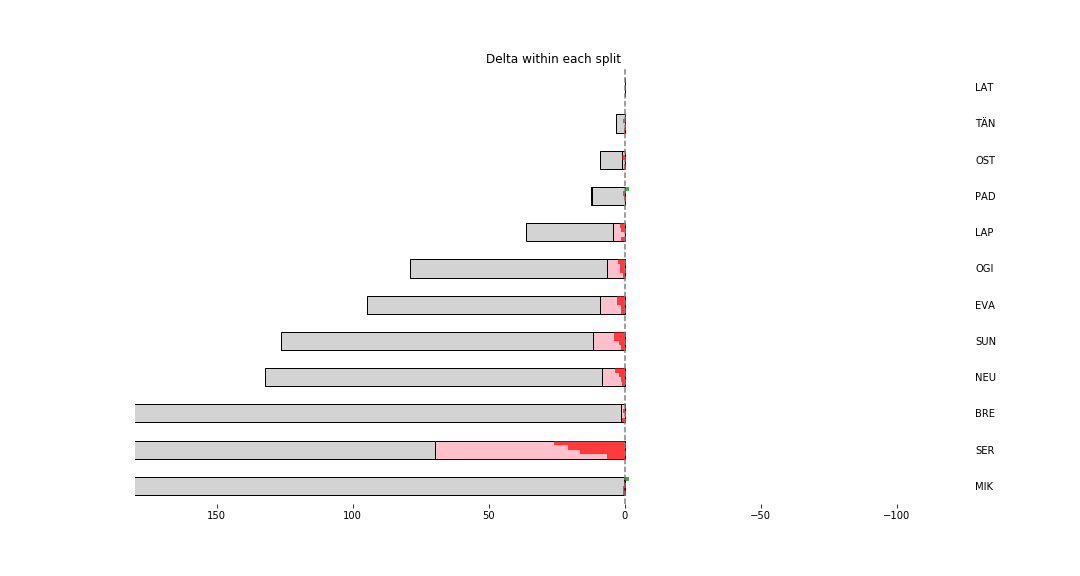
Stage Within Split Delta Chart - Australia, 2018 - LAT - SS13
For the specified driver, show the delta for each split section relative to the other drivers.
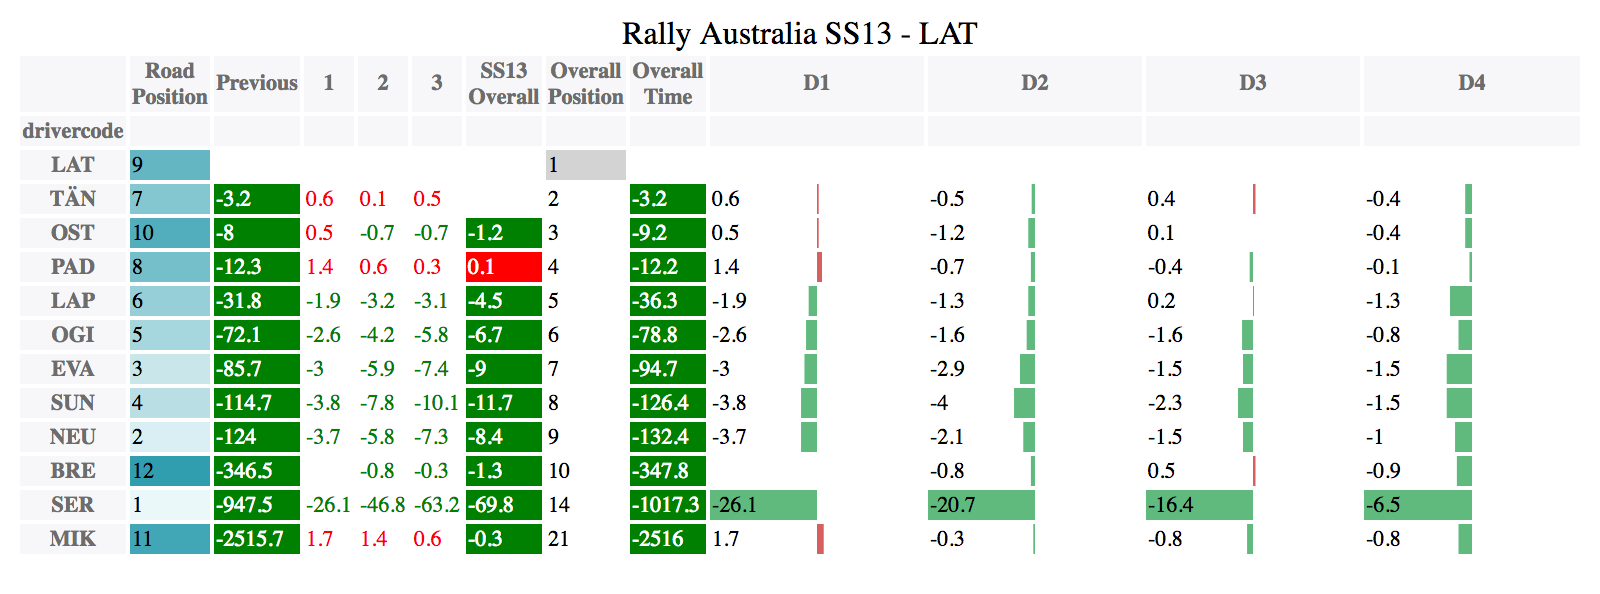
Stage Progress Chart - Australia, 2018 - LAT - SS13
The stage progress chart shows times rebased relative to the specified driver and highlights:
- the overall gap relative to other drivers at the start of the stage;
- the time gained / lost relative to other drivers on the stage;
- the overall gap relative to other drivers at the end of the stage.
| Driver | Team | Elapsed Duration | Position | Class Rank | diffFirst | diffPrev |
|---|---|---|---|---|---|---|
| PAD | HYUNDAI SHELL MOBIS WRT | 00:07:16.8 | 1 | 1 | 00:00:00 | 00:00:00 |
| LAT | TOYOTA GAZOO RACING WRT | 00:07:16.9 | 2 | 2 | 00:00:00.1 | 00:00:00.1 |
| TÄN | TOYOTA GAZOO RACING WRT | 00:07:16.9 | 3 | 3 | 00:00:00.1 | 00:00:00 |
| MIK | HYUNDAI SHELL MOBIS WRT | 00:07:17.2 | 4 | 4 | 00:00:00.4 | 00:00:00.3 |
| OST | CITROEN TOTAL ABU DHABI WRT | 00:07:18.1 | 5 | 5 | 00:00:01.3 | 00:00:00.9 |
| BRE | CITROEN TOTAL ABU DHABI WRT | 00:07:18.2 | 6 | 6 | 00:00:01.4 | 00:00:00.1 |
| LAP | TOYOTA GAZOO RACING WRT | 00:07:21.4 | 7 | 7 | 00:00:04.6 | 00:00:03.2 |
| OGI | M-SPORT FORD WORLD RALLY TEAM | 00:07:23.6 | 8 | 8 | 00:00:06.8 | 00:00:02.2 |
| NEU | HYUNDAI SHELL MOBIS WRT | 00:07:25.3 | 9 | 9 | 00:00:08.5 | 00:00:01.7 |
| EVA | M-SPORT FORD WORLD RALLY TEAM | 00:07:25.9 | 10 | 10 | 00:00:09.1 | 00:00:00.6 |
| SUN | M-SPORT FORD WORLD RALLY TEAM | 00:07:28.6 | 11 | 11 | 00:00:11.8 | 00:00:02.7 |
| SER | M-SPORT FORD WORLD RALLY TEAM | 00:08:26.7 | 17 | 12 | 00:01:09.9 | 00:00:12.9 |